This roadmap is crafted for a fresher—someone with a passion for systems, a love for automation, and a desire to build the discipline that keeps modern software running. You will learn Monitoring, Incident Response, and Service Level Indicators (SLIs) by building the mindset and skills that form the core of Site Reliability Engineering. The goal is to transform you from someone who "fixes things when they break" into an engineer who builds systems that rarely break, and when they do, heal themselves or resolve with minimal disruption. This path prepares you for entry-level roles like Junior Site Reliability Engineer, Reliability Analyst, or Production Support Engineer in a market where demand for SREs has grown by over 30% year-over-year as organizations struggle to maintain complex distributed systems. Understanding the difference between DevOps (cultural movement) and SRE (prescriptive engineering implementation) is key; as Google describes it, SRE is "what happens when you ask a software engineer to design an operations team".
🗺️ Phase 1: The Mindset Shift – SRE is Software Engineering Applied to Operations (Weeks 1-2)
Before you monitor your first metric or write your first runbook, understand that SRE is fundamentally a software engineering role focused on operations problems. Unlike traditional system administrators who perform manual tasks, you will write code to automate operational work. When you encounter a repetitive task—what Google calls "toil"—you will build software to eliminate it. This engineering-first mindset is the most critical foundation to develop.
What a Site Reliability Engineer Actually Does
Site Reliability Engineers blend software engineering with systems operations to build and maintain large-scale, distributed systems with a focus on reliability, availability, and performance. Your core responsibilities include:
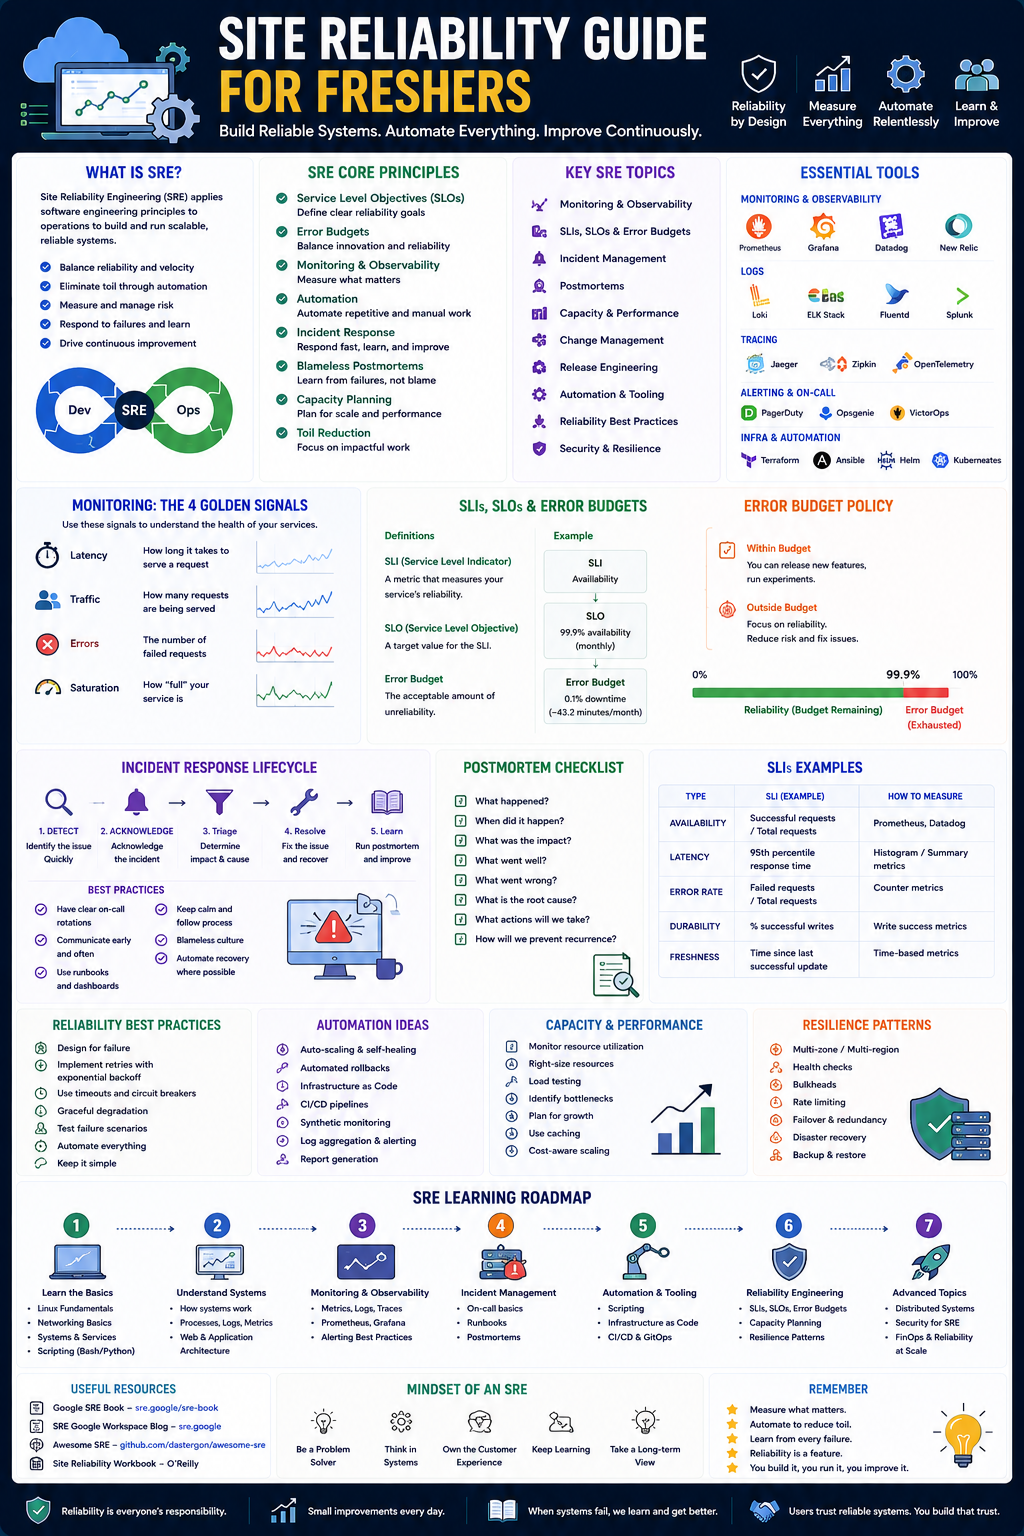
- Ensuring System Uptime and Performance: Defining what "reliable" means through Service Level Indicators (SLIs) and Service Level Objectives (SLOs), then building the monitoring to track them.
- Incident Response and Management: When outages occur, you lead the response, mitigate impact, and conduct blameless post-mortems to prevent recurrence.
- Automation and Tooling: Eliminating toil by automating repetitive operational tasks. If you spend your time restarting failed services manually or running the same diagnostic commands, you are working in the system instead of on it.
- Capacity Planning and Performance Optimization: Analyzing system behavior under load and implementing improvements to ensure services can scale.
Core Concepts to Master: SLIs, SLOs, and Error Budgets
These are the language of reliability. You must learn them before any tool:
- Service Level Indicator (SLI): A quantitative measure of a service's behavior. Common SLIs include availability (proportion of successful requests), latency (time to respond), and error rate. An example: "Proportion of HTTP GET requests that return status 200."
- Service Level Objective (SLO): A target value for an SLI over a specific period. An example: "99.9% of requests will complete successfully in a 30-day rolling window."
- Error Budget: The acceptable amount of unreliability derived from the SLO. For a 99.9% SLO, the error budget is 0.1%—roughly 43 minutes of downtime per month.
Practice Goal for Phase 1: Pick an application you use (e.g., a weather app or your favorite website). Propose an appropriate SLI for its critical feature, an SLO that balances reliability and velocity, and calculate the error budget. Explain why you chose those numbers.
Free Resources for Phase 1:
- Bhavuk Mudgal's SRE Roadmap 2026: An excellent, interview-focused path emphasizing fundamentals over tool-hoarding. Highlights why networking and Linux fundamentals matter more than tools and covers SLIs, SLOs, SLAs, and error budgets in interview context.
- LeetCode SRE Fresher Role Discussion: A real job description showing exactly what skills freshers need: Python automation, ELK/Splunk/Prometheus/Grafana, AWS/Azure troubleshooting, and incident management.
📊 Phase 2: Foundations – Linux, Networking, and the "System" Mindset (Weeks 3-6)
Before building observability, you must understand what you are observing. SREs need deep system-level understanding because production issues rarely stem from a single cause.
Linux System Internals
Mastering Linux is non-negotiable:
- Process management (
ps, top, htop, systemd) - Memory and CPU analysis (
free, vmstat, mpstat) - Disk I/O and filesystems (
iostat, df, du, lsof) - Networking stack (
ss, netstat, tcpdump) - System logs and journaling (
journalctl)
Networking Fundamentals
Understanding how data travels is critical for diagnosing complex issues:
- TCP/IP stack and connection lifecycles (three-way handshake)
- HTTP/HTTPS protocols and common status codes
- DNS resolution and troubleshooting
- Load balancing concepts (L4 vs L7)
Programming Proficiency
SREs must code. Python is the most common for automation, with Go also popular for performance-critical systems:
- Python scripting for automation (file operations, API calls, log parsing)
- Working with JSON/YAML for configuration
- Basic data structures and algorithms for efficient code
Practice Goal: Write a Python script that queries a system's CPU and memory usage, formats it as JSON, and prints a "health status" with appropriate thresholds.
Free Resources for Phase 2:
- Linux Fundamentals: Free tutorials on understanding how operations work. Specific commands and scenarios referenced in many helpdesk syllabi are directly applicable.
- LeetCode SRE Job Description: Lists Python, basic troubleshooting, and cloud platforms as key requirements for a fresher role.
🔧 Phase 3: The Observability Stack – Metrics, Logs, and Traces (Weeks 7-12)
Observability is how you understand the internal state of your system based on its external outputs. Modern SREs build on the MELT stack: Metrics, Events, Logs, and Traces.
Metrics Collection with Prometheus
Prometheus is the industry standard for collecting time-series metrics:
- Core Concepts: Understanding metrics types (counters, gauges, histograms), how Prometheus scrapes targets, and basic PromQL (Prometheus Query Language) for analysis.
- Exporters: Using node_exporter for system metrics and blackbox_exporter for endpoint probing.
- Alerting: Configuring Alertmanager to route alerts based on conditions (e.g., high error rate).
Visualization with Grafana
Grafana transforms metrics into dashboards that tell a story:
- Creating dashboards for different audiences (engineering vs. management)
- Building panels with PromQL queries
- Setting up dynamic dashboards with variables
Log Aggregation with the ELK Stack
Logs provide high-cardinality debugging details:
- Elasticsearch: Storing and indexing log data
- Logstash: Ingesting and transforming logs
- Kibana: Querying and visualizing logs
- Fluentd: A lightweight log forwarder alternative
Introduction to Distributed Tracing
For microservices, understanding a request's journey is essential:
- OpenTelemetry (OTel): The emerging standard for generating telemetry data.
- Jaeger or Tempo: Backends for visualizing trace waterfalls and identifying bottlenecks.
Practice Goal: Set up a local environment with Docker (Prometheus + Grafana + Node Exporter). Scrape metrics from your local machine, build a dashboard showing CPU and memory usage, and configure an alert for high CPU load.
Free Resources for Phase 3:
- Pluralsight SRE: Monitoring and Observability (Free Trial): Teaches designing effective monitoring, implementing SLIs, and exploring AIOps.
- LeetCode SRE Job Description: Explicitly lists Prometheus and Grafana for monitoring, plus ELK or Splunk for logs.
🚨 Phase 4: Incident Response – From Detection to Resolution (Weeks 13-16)
When systems fail, the response determines the outcome. SREs bring structure to chaos through formal incident management processes.
The Incident Command Framework
Treat incidents like emergency responses:
- Incident Commander: The single person coordinating response, not necessarily fixing the issue.
- Communications Lead: Managing internal and external status updates.
- Operations Lead: Hands-on debugging and implementing fixes.
- Planning Lead: Documenting actions and managing timeline.
The OODA Loop (Observe-Orient-Decide-Act)
A decision-making framework for high-pressure situations, adapted from military strategy:
- Observe: Collect data from dashboards and logs
- Orient: Analyze the situation and form a mental model
- Decide: Choose a course of action
- Act: Execute and observe results
Runbooks and Playbooks
Documentation is critical for consistent response:
- Runbooks: Step-by-step instructions for executing specific tasks (e.g., "How to restart a service").
- Playbooks: High-level plans for coordinating responses (e.g., "Database outage response").
Blameless Post-Mortems
After an incident, the goal is learning, not punishment:
- Documenting the timeline of events
- Identifying root cause(s) without pointing fingers
- Proposing action items to prevent recurrence
- Tracking these actions to completion
Practice Goal: Write a runbook for responding to a "High CPU Usage" alert. Include verification steps, diagnostic commands, and escalation paths. Then, in a safe lab environment, deliberately cause high CPU and follow your runbook.
Free Resources for Phase 4:
- Pluralsight SRE Learning Path: Includes "High-Stakes Incident Response and Retrospectives" and "Managing team toil levels".
- Pluralsight Monitoring and Observability Course: Covers alerting and automated responses to issues.
🧪 Phase 5: Chaos Engineering and Proactive Reliability (Weeks 17-18)
Chaos Engineering is the practice of running experiments to uncover systemic weaknesses before they cause customer-facing outages. Netflix pioneered this with their Chaos Monkey.
Principles of Chaos Engineering
- Stability as a Hypothesis: Define what "normal" looks like (your SLOs).
- Run Experiments in Production: Staging environments rarely match production complexity.
- Minimize Blast Radius: Start with small, contained experiments.
- Automate and Run Continuously: Make chaos part of regular operations.
Game Days
Structured chaos experiments where teams practice incident response in low-stakes environments:
- Planning: Define the scenario, success criteria, and safety measures.
- Execution: Run the experiment while observing system behavior.
- Analysis: Review results, document weaknesses, and create action items.
Practice Goal: In a virtual lab, simulate a network partition between two services in your application. Observe how the system behaves. Does it degrade gracefully? Does it recover automatically when the partition is resolved?
Free Resources for Phase 5:
- SGInnovate SRE Practitioner Course: Covers Chaos Engineering definitions, myths, experiments, resources, and Game Day basics.
🤖 Phase 6: AI in SRE – The 2026 Augmentation (Weeks 19-20)
AI is not replacing SREs, but it is becoming a powerful tool for analyzing alerts, correlating data, and accelerating root cause analysis. The goal is to free SREs from repetitive toil to focus on engineering.
AIOps (Artificial Intelligence for IT Operations)
Using AI and ML to automate and enhance IT operations:
- Anomaly Detection: Algorithms that learn normal behavior and flag deviations automatically.
- Alert Correlation: Grouping related alerts to reduce "alert fatigue."
- Root Cause Analysis: Suggesting likely causes based on historical incident data.
Practical AI Use for Freshers
- LLM-Assisted Analysis: Use tools like ChatGPT to analyze error logs or explain complex queries, but always verify their output.
- Automated Summarization: AI tools can summarize long incident timelines or post-mortem documents.
- ChatOps: Using conversational AI in Slack/MS Teams to run diagnostic commands or answer operational questions.
Practice Goal: Use a free LLM to analyze a sample error log from an application. Ask it to identify potential root causes and suggest troubleshooting steps. Compare its suggestions with the actual known cause. Learn where AI excels and where it falters.
Free Resources for Phase 6:
- Pluralsight SRE Monitoring Course: Final module covers new tools in the AIOps space.
- Cleric AI SRE Agent: First self-learning AI SRE agent that continuously learns from incidents and integrates with existing tooling. Not free, but understanding the technology is valuable.
📚 Consolidated Resource Toolkit
Completely Free, Comprehensive Resources
Bhavuk Mudgal's SRE Roadmap 2026 (Medium/LinkedIn) is an interview-focused practical path emphasizing how SRE interviewers think, why fundamentals matter, and how to build system-level understanding. Covers SLIs/SLOs/SLAs/error budgets with interview context.
LeetCode SRE Fresher Role Discussion provides a real job description showing required skills: Python automation, monitoring tools (ELK, Splunk, Prometheus, Grafana), cloud platforms (AWS/Azure), incident management, and root cause analysis.
Indeed SRE Career Guide covers the complete career path including educational background, work experience, certifications (Google Professional Cloud Architect, Microsoft Azure Solutions Architect), programming proficiency (Python, Java, Ruby), network systems, and data structures/algorithms.
High-Value Structured Training
Pluralsight Site Reliability Learning Path offers a curated set of courses on SRE philosophy, measuring reliability (SLIs/SLOs/SLAs), full-stack observability, incident response, and engineering for scale. Includes Skill IQ assessments and certificates. Free trial available.
Pluralsight SRE: Measuring and Managing Reliability teaches the Google Cloud course on SLIs, SLOs, and Error Budgets, walking through development for an example service. Free trial available.
Pluralsight SRE: Monitoring and Observability covers observability stack components, SLIs, alerting, automated responses, and AIOps tools. Free trial available.
SGInnovate SRE Practitioner Course covers SRE anti-patterns, SLIs/SLOs, error budgets, full-stack observability (MELT), OpenTelemetry, Platform Engineering, AIOps, Incident Command Framework, OODA Loop, Chaos Engineering, and Game Days.
Your Practice Sandbox
- Local Environment: Docker + Prometheus + Grafana + Node Exporter
- Cloud Free Tier: AWS Free Tier (EC2, CloudWatch) or Azure Free Account
- Version Control: GitHub for storing configs, runbooks, and scripts
- LLM Access: ChatGPT or Claude for AI-assisted learning
💼 Career Application & Next Steps
Site reliability engineering is one of the fastest-growing and most rewarding career paths in tech. The demand for SREs has increased over 30% year-over-year as organizations build complex distributed systems that cannot be managed manually. A typical entry-level SRE job posting includes responsibilities like developing automation scripts, monitoring system health with Prometheus and Grafana, cloud troubleshooting (AWS/Azure), participating in incident management and root cause analysis, and clear documentation of processes.
1. The Fresher Entry Point
Junior Site Reliability Engineer / Production Support Engineer: Focuses on monitoring systems, responding to incidents, writing automation scripts, and building foundational SRE practices. Requires Python, basic Linux, monitoring tools, and incident management understanding.
Reliability Analyst: Focuses more on data analysis of SLIs/SLOs, error budget tracking, and post-mortem documentation while building operational skills.
Cloud Support Associate (Reliability Focus) : Frontline role supporting cloud infrastructure for customers—excellent entry point for learning about production systems at scale.
Industries actively hiring include technology (SaaS, FAANG, startups), financial services (trading platforms, payment systems requiring high reliability), e-commerce (especially pre/post-peak seasons), healthcare (24/7 systems requiring compliance), and telecom (network infrastructure).
2. The Career Progression Path
0-2 years – Junior SRE / Production Support
- Focus: Tickets, monitoring, automation scripts, incident triage
2-5 years – Site Reliability Engineer
- Focus: SLO definition, capacity planning, chaos experiments, on-call rotation
5-8 years – Senior SRE
- Focus: Infrastructure architecture, SRE team leadership, complex incident command
8+ years – Principal SRE / SRE Manager
- Focus: Strategic direction, error budget policies, cross-organization reliability initiatives
3. Build Your Portfolio (Three Definitive Projects)
Project 1 (Observability Stack Deployment) :
- What: Set up a complete monitoring stack using Docker (Prometheus + Grafana + Node Exporter + Alertmanager). Configure dashboards for key system metrics.
- Why: Demonstrates you can build an observability pipeline—the core of SRE work.
Project 2 (Runbook and Playbook Suite) :
- What: Document runbooks (task-level) and playbooks (process-level) for 5 common incident scenarios (e.g., database connection pool exhaustion, API latency spike, disk space alert).
- Why: Documentation is critical for consistent incident response. A portfolio of high-quality runbooks proves you can operationalize reliability.
Project 3 (Full Lifecycle Incident Response) :
- What: Simulate an incident in your lab (e.g., a "memory leak" script). Document the complete response: detection, diagnosis, mitigation, post-mortem, and follow-up actions.
- Why: This covers the entire incident lifecycle—exactly what SREs do during outages.
How to Document Your Portfolio: Create a GitHub repository named "sre-portfolio." For each project, include README.md with architecture diagram (draw.io is free), setup instructions, configuration files (e.g., Prometheus prometheus.yml), screenshots of dashboards and alerts, and a reflection on what you learned.
4. Certifications That Open Doors
While experience matters most, certifications validate your knowledge:
Google Professional Cloud Architect : Recognized by employers as demonstrating advanced cloud infrastructure knowledge.
Microsoft Azure Solutions Architect : Another highly respected certification for cloud skills.
AWS Certified DevOps Engineer : Validates CI/CD, monitoring, and automation expertise on AWS.
Pluralsight Completion Certificates : While not official certifications, completing their learning paths provides tangible proof of knowledge acquisition.
5. The Interview Question You Will Be Asked
Question: "A user reports that the checkout page is slow. Your dashboards show no unusual CPU or memory usage. What do you do?"
Your Answer: "First, I would avoid jumping to conclusions. Since CPU and memory are normal, I would expand my investigation. I would check latency percentiles—maybe the median is fine, but the 99th percentile is high. I would look at network latency between services and database query performance. A slow checkout could indicate a database query missing an index, especially if only certain user types are affected.
*I would trace a specific slow request using our distributed tracing tool (Jaeger/Tempo) to see where time is being spent. If tracing shows a call to a discount service taking 2 seconds, I would then check that service's logs. I would also verify if this is a known issue—checking our runbooks and recent changes.*
If it's a database issue, I would work with the DBA team to identify slow queries. If it's a network issue between microservices, I would check for packet loss or saturated links. Throughout, I would communicate status to stakeholders and document my findings in the incident ticket. After resolution, I would lead a blameless post-mortem to identify the root cause and action items, such as adding an index, implementing a circuit breaker, or improving our monitoring to detect this issue automatically next time."
This answer demonstrates systematic troubleshooting, knowledge of advanced metrics (percentiles) and tracing tools, and process awareness (runbooks, post-mortems). It highlights reducing Mean Time To Resolution (MTTR).
6. Sample Resume Entry (No Experience Version)
text
Junior Site Reliability Engineer Candidate | Home Lab Portfolio

TECHNICAL SKILLS
- Languages: Python (automation, scripting), Bash, basic Go
- Observability: Prometheus, Grafana, ELK Stack (Elasticsearch, Logstash, Kibana)
- Cloud: AWS (EC2, CloudWatch), Azure (basic)
- OS: Linux (Ubuntu, command-line proficiency)
- Concepts: SLIs, SLOs, Error Budgets, Incident Command

PROJECTS

Observability Stack with Prometheus and Grafana
- Deployed Prometheus + Grafana + Node Exporter using Docker Compose
- Built dashboards tracking CPU, memory, disk, and network metrics
- Configured Alertmanager to send alerts for high CPU load
- Documented setup in comprehensive README on GitHub

Incident Response Runbook Suite
- Authored 5 runbooks for common failure scenarios (database connection pool, API latency spike, etc.)
- Authored 1 playbook for "Database Degradation" response
- Simulated "Database Connection Exhaustion" incident using Python script to consume connections
- Documented complete response: detection → diagnosis → mitigation → post-mortem

CERTIFICATIONS (In Progress)
- Pluralsight SRE Learning Path
- AWS Cloud Practitioner (foundation)

EDUCATION
- Bachelor's in Computer Science (or relevant coursework)
- Self-directed SRE study (homelab, Pluralsight courses)
🎯 Your Next Steps for This Week
Do not try to learn Prometheus, Kubernetes, and Python simultaneously. Build momentum with small wins. You are building a discipline, not just skills. The goal is not to know every tool but to understand how systems fail and how to systematically respond.
Step 1: Set Up Your Lab Environment (Day 1)
Install Docker Desktop. Create a GitHub account. Install Python. You now have a free, powerful lab environment.
Step 2: Start a Structured Course (Week 1)
Begin the Google Cloud course "Site Reliability Engineering: Measuring and Managing Reliability" on Pluralsight (free trial) to understand SLIs and SLOs conceptually.
Step 3: Deploy Your First Monitoring Stack (Week 2)
Follow the official Prometheus documentation tutorial. Use docker-compose to run Prometheus, Grafana, and Node Exporter. See live metrics.
Step 4: Write Your First Python Automation Script (Week 2)
Write a script that checks the health of a website (HTTP status code) and prints a message. This is a foundation for automated checks.
Step 5: Write Your First Runbook (Week 3)
Write a simple runbook for a hypothetical "Service X has high error rate." Review your approach.
Step 6: Join the Community
Follow #SRE, #DevOps, and #Observability on LinkedIn. Review r/sre on Reddit. The SRE community is collaborative, and you will learn much from incident post-mortems shared by other companies.
The moment you set up an alert that catches a problem before your users notice—or write a post-mortem that prevents the same mistake from happening twice—you will understand the value of Site Reliability Engineering. You are not just keeping the lights on. You are building systems that learn from failure and improve over time. That is the SRE discipline. You have the roadmap. Start your journey today.


 Group / 1: 1 Sessions