AI-Powered Supply Chain Analytics Training Roadmap (Blue Yonder, Llamasoft, Python, R, Tableau)
This roadmap is designed for operations and supply chain professionals who want to master the convergence of enterprise supply chain platforms, data science, and visualization. The discipline has fundamentally shifted—what once required intuition and historical spreadsheets now demands AI-driven predictive analytics, network optimization, and real-time visibility across the entire value chain . The gap for supply chain analytic talent is significant—organizations need professionals who can bridge the operational and digital worlds to elevate decision-making through the science of smarter analytics .
Understanding the Supply Chain Analytics Stack
Before diving into training, understand how these tools work together across the analytics maturity spectrum :
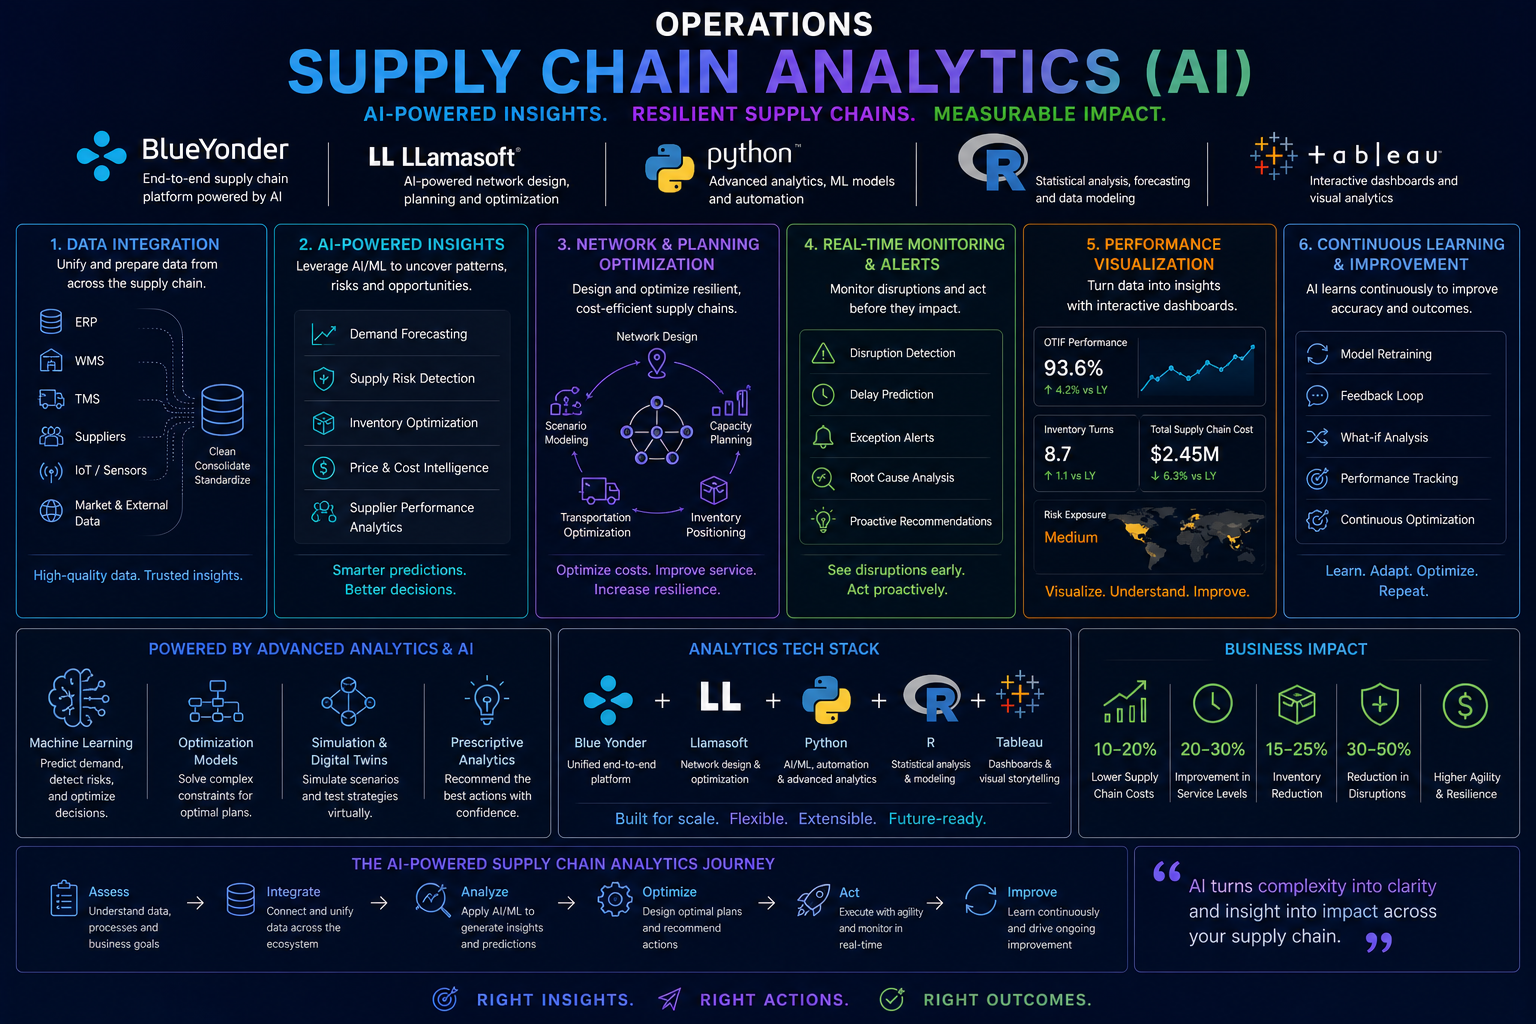
Blue Yonder provides enterprise-level AI and machine learning capabilities for demand forecasting, inventory optimization, and supply chain planning. Its AI-driven insights help organizations respond dynamically to market changes, accurately predict demand, and optimize inventory levels across global operations . The platform offers predictive analytics for demand planning and prescriptive analytics for operational optimization .
Llamasoft (now Coupa) is the only supply chain design application that integrates both optimization and simulation into a single tool. Its all-in-one design engine uses advanced algorithms and machine learning for network optimization, product flow-path analysis, cost-to-serve modeling, inventory optimization, and production and transportation planning . Use simulation to test supply chain designs against real-world variables and business needs before operationalizing decisions .
Python serves as your workhorse for data manipulation, optimization modeling, and machine learning. The PuLP framework enables linear programming for supply chain optimization problems . Pandas handles data wrangling at scale. Scikit-learn and other ML libraries enable demand forecasting and predictive analytics.
R excels at statistical forecasting and time series analysis. The 'sweep' package extends forecasting to multiple models simultaneously, comparing ARIMA, ETS, and BATS models against each other . Statistical libraries support inventory optimization and demand planning.
Tableau transforms complex supply chain data into actionable insights through visualization. You will build dashboards for shipment tracking, inventory levels, demand forecasting visualization, and performance metrics . The Tableau Public platform allows you to create, share, and showcase dashboards for employers .
The 16-Week AI Supply Chain Analytics Training Roadmap
Phase 1: Weeks 1-4 – Supply Chain Analytics Foundations & Strategy
What to focus on
Before touching any tool, understand the strategic framework of supply chain analytics. The discipline spans four maturity levels and multiple functional areas.
Descriptive Analytics answers "what happened?" using historical data. You analyze past demand patterns, inventory turns, on-time delivery rates, and supplier performance. This forms the baseline for all advanced analytics.
Diagnostic Analytics answers "why did it happen?" using root cause analysis. You identify why stockouts occurred, why shipments were delayed, or why forecast accuracy degraded. AI can surface correlations you might otherwise miss.
Predictive Analytics answers "what will happen?" using machine learning. You forecast future demand, predict which suppliers might fail, anticipate transportation delays, and identify customers at risk of churn .
Prescriptive Analytics answers "what should we do?" using optimization. You determine optimal inventory levels, recommend network changes, suggest production schedules, and prescribe mitigation strategies .
Key functional areas you must understand include demand forecasting and demand sensing, inventory optimization including safety stock and reorder points, supply chain planning and production scheduling, network design and facility location, risk management and disruption mitigation, and transportation and logistics optimization .
The importance of AI-driven supply chain visibility cannot be overstated. Real-time data collection and integration across multiple systems provides the foundation for effective analytics. By leveraging real-time data and advanced analytics, organizations can monitor performance, identify inefficiencies, and respond proactively to disruptions .
Free resources for Phase 1
The MSU Broad College of Business collaborated with LLamasoft to offer online learning and certification programs to students at no cost, addressing the gap for supply chain analytic talent . While this specific program may have been time-limited, it demonstrates that university-industry partnerships exist. Supply chain management departments frequently offer open courses. Check your local university's supply chain program for open enrollment options.
Paid resources for Phase 1
Coursera offers "Supply Chain Analytics" specialization through Rutgers University covering descriptive, predictive, and prescriptive analytics. edX provides "MITx Supply Chain Management" MicroMasters program covering analytics fundamentals. LinkedIn Learning has "Supply Chain Analytics Essential Training" for foundational concepts.
Practical application
Map your organization's current analytics maturity across the four levels. Identify one decision in each category that could be improved with better analytics. Document the data you currently have, the data you need, and the gap between them. This strategic assessment is exactly what hiring managers for supply chain analytics roles expect you to produce.
Phase 2: Weeks 5-8 – Enterprise Platforms: Blue Yonder AI Capabilities
What to focus on
Blue Yonder's AI and machine learning capabilities transform how organizations forecast, plan, and optimize supply chains .
Demand forecasting with AI
Utilizing AI for accurate demand predictions requires understanding time series forecasting techniques. Blue Yonder's AI analyzes historical patterns, external factors, and market signals to improve forecast accuracy . You will learn case studies of AI-driven demand forecasting that demonstrate measurable improvements in prediction accuracy.
Inventory optimization
Leveraging machine learning for inventory management transforms how you calculate safety stock and reorder points. AI-driven strategies reduce stockouts while minimizing excess inventory . The system continuously learns from demand patterns to adjust inventory parameters dynamically.
Supply chain planning and scheduling
AI-driven planning techniques optimize production schedules and enhance capacity planning with predictive analytics . You will learn how machine learning improves schedule adherence while accommodating real-time disruptions.
Risk management and mitigation
Identifying risks in the supply chain requires AI for risk prediction and management . You will develop contingency plans based on AI insights, stress-testing your supply chain to see where unknown capacity constraints surface .
Collaborative decision making
Enhancing collaboration across supply chain partners using AI to share insights and data builds a data-driven culture within organizations . This is where analytics becomes operationalized across teams.
Implementing supply chain visibility solutions
Blue Yonder for supply chain visibility enables real-time data collection and integration from multiple systems. Key performance indicators for visibility include on-time delivery, order cycle time, cash-to-cash cycle, and perfect order percentage .
Free resources for Phase 2
Blue Yonder offers product demos and recorded webinars through their website. The Locus IT training page outlines the complete curriculum for Blue Yonder AI and Machine Learning capabilities . MSU's partnership with LLamasoft demonstrates that academic institutions can provide access to enterprise software training .
Paid resources for Phase 2
Blue Yonder training is available through authorized training partners like Locus IT Services, with online training modes available . Proexcellency offers LLamasoft Supply Chain Management online training . Full platform access requires enterprise licensing typically costing thousands annually.
Practical application
Using publicly available case studies or a demo environment, document how AI could improve a specific supply chain process in your organization. Choose either demand forecasting, inventory optimization, or risk management. Develop a one-page business case showing expected ROI from implementing AI-driven capabilities. This demonstrates strategic thinking beyond platform knowledge.
Phase 3: Weeks 9-12 – Python and R for Supply Chain Optimization
What to focus on
This phase builds your technical foundation for supply chain analytics. You will learn to model and solve optimization problems using Python's PuLP framework and perform advanced forecasting using R.
Python for supply chain optimization
The PuLP framework enables linear programming for supply chain optimization problems . PuLP is an LP modeler written in Python that can generate MPS or LP files and call solvers like GLPK, COIN CLP/CBC, CPLEX, and GUROBI to solve linear problems. You will learn basic installation using pip install pulp.
Essential packages for supply chain analytics include random module, Pandas for data manipulation, Matplotlib for visualization, and PuLP for mathematical modeling . Complete Jupyter notebooks covering network design and facility location demonstrate how to gradually learn optimization concepts.
A case study in capacitated plant location puts together all the concepts—balancing production costs, transportation costs, and capacity constraints to determine optimal facility locations and flows . The network design optimization model minimizes total cost including production costs and freight costs across multiple factories, products, and customers .
R for demand forecasting
The 'sweep' package extends forecasting to multiple models simultaneously. You will learn to coerce data to time series using tk_ts(), build a model list using nested lists with function names as keys and parameters as second-level name-value pairs .
Apply multiple models to a time series including ARIMA (AutoRegressive Integrated Moving Average), ETS (Error, Trend, Seasonal), and BATS (Box-Cox, ARMA, Trend, Seasonal). Compare model accuracy using sw_glance() which yields AIC values and other metrics to directly compare fit across models .
The forecasting process includes building the model dataframe, invoking function maps with invoke_map(), inspecting model parameters with sw_tidy(), checking model accuracy with sw_glance(), and viewing residuals with sw_augment().
For inventory optimization, implement EOQ (Economic Order Quantity) models to compute optimal order quantities. Calculate safety stock based on demand variability and lead time uncertainty. Determine reorder points using average daily demand, replenishment lead times, and safety stock .
Free resources for Phase 3
GitHub repository "supply_chains_optimization" provides complete Jupyter notebooks demonstrating optimization using PuLP . The repository includes six notebooks numbered for gradual learning, with the final case study putting all concepts together. R documentation for the 'sweep' package provides complete vignettes on forecasting using multiple models . RStudio.Cloud offers free tiers for practicing R without local installation.
Paid resources for Phase 3
DataCamp offers "Supply Chain Analytics in Python" and "Supply Chain Analytics in R" courses with structured learning paths. Coursera provides "Supply Chain Optimization" using Python. Udemy has "Supply Chain Analytics with Python" for practical implementation.
Practical application
Using the PuLP framework from the GitHub repository, adapt the capacitated plant location case study to a scenario with 3 factories, 5 products, and 10 customers . Implement your own demand forecasting model in R using the 'sweep' package, comparing ARIMA, ETS, and BATS models on a demand dataset. Document which model performs best and why based on AIC and residual analysis . These two projects demonstrate your ability to both optimize network design and forecast demand—core competencies for supply chain analytics roles.
Phase 4: Weeks 13-16 – Visualization with Tableau and Career Preparation
What to focus on
This phase integrates everything into executive-ready dashboards. Tableau transforms complex supply chain data into insights that drive decisions .
Building Tableau skills for supply chain
Start with the basics: navigation, basic charts, and drag-and-drop functionality . YouTube offers full beginner courses covering these fundamentals. Connect Tableau to real supply chain data—sample datasets are available for free download .
Create visualizations for supply chain KPIs: inventory turnover by SKU and location, on-time delivery performance over time, forecast accuracy by product family, supplier scorecards and lead time trends, transportation cost per unit by lane, and fill rate by distribution center .
Designing effective dashboards
Create dynamic dashboards using filters, parameters, and interactive features to make reports engaging . Advanced Tableau dashboards include actions, tooltips, and user-driven exploration.
The DataCamp case study for supply chain analytics in Tableau teaches you to help solve key challenges of shipment and inventory management, analyze supply chain inefficiencies, and create insightful dashboards to inform business stakeholders . You will use a wide range of Tableau skills including calculations and visualizations, then bring findings together into interactive dashboards demonstrating clear insights .
The Tableau Community and Public Gallery
Join the Tableau Community to connect with others, learn faster, and stay updated on best practices . Tableau Public allows you to create, share, and showcase your dashboards—building a portfolio that impresses employers . The Public Gallery contains thousands of supply chain dashboards for inspiration.
Integrating analytics, network design, and visualization
The complete analytics workflow demonstrates how all tools work together. Use Python to optimize network design and model flows . Use R to forecast demand and compare model accuracy . Use Tableau to visualize KPIs and communicate insights . The result is an integrated analytics capability that transforms raw data into strategic decisions.
Free resources for Phase 4
YouTube's "Tableau for Beginners - Full Course" provides comprehensive foundation training . Free sample datasets are available for download to practice with real data . Tableau Community forums offer millions of users sharing solutions. Tableau Public is completely free for building and sharing portfolios . DataCamp's supply chain analytics case study provides structured learning (4 hours, subscription required) .
Paid resources for Phase 4
DataCamp subscription (25−30/month)includesthefullsupplychainanalyticscasestudy[citation:10].TableauDesktoplicenseisapproximately
25−30/month)includesthefullsupplychainanalyticscasestudy[citation:10].TableauDesktoplicenseisapproximately70/user/month. Tableau eLearning subscriptions are 15−30/monthforstructuredlearningpaths.TheTableauDesktopSpecialistcertificationexamcosts
15−30/monthforstructuredlearningpaths.TheTableauDesktopSpecialistcertificationexamcosts125.
Practical application
Build a complete supply chain analytics dashboard connecting to sample data or using the case study dataset . Include a demand forecast visualization, an inventory optimization view, a supplier scorecard, and an executive summary. Make the dashboard interactive—allow users to filter by product category, region, or time period using parameters and actions . Publish to Tableau Public and share the link on your LinkedIn profile. This comprehensive project demonstrates full-stack supply chain analytics capability from data to insight to action .
Your Portfolio Projects
Build these four artifacts during your training. They demonstrate exactly what hiring managers for supply chain analytics roles are looking for.
Project One: The AI-Driven Demand Forecast – Using R and the 'sweep' package, generate demand forecasts for a product dataset comparing ARIMA, ETS, and BATS models . Document which model performed best and why based on AIC, residuals, and forecast plots. Present as a one-page model recommendation brief.
Project Two: The Network Optimization Model – Using Python and PuLP from the GitHub repository, implement a capacitated facility location model for a real or mock supply chain . Document your assumptions, data sources, constraints, and optimal solution. Show how the model balances production costs and transportation costs.
Project Three: The Supply Chain Analytics Dashboard – Using Tableau, build an executive dashboard showing inventory turns, on-time delivery, forecast accuracy, and supplier scorecards . Include interactive filters for region, product category, and time period. Publish to Tableau Public.
Project Four: The Integrated Analytics Case Study – Combine all three previous projects into a complete case study. Use Python to optimize network design, R to forecast demand, and Tableau to visualize KPIs. Write an executive summary explaining how the integrated analytics capability would improve decision-making. This comprehensive project demonstrates that you understand how the entire stack works together—the skill most valued by employers .
Career Application
Job Titles to Target
Supply Chain Data Analyst requires one to three years of experience. You analyze supply chain data, build dashboards, and identify optimization opportunities. The salary range is 60,000to
60,000to90,000.
Supply Chain Analytics Specialist requires two to four years of experience. You implement forecasting models, optimize inventory parameters, and support network design studies. The salary range is 70,000to
70,000to100,000.
Supply Chain Planner (AI-Augmented) requires three to five years of experience. You use AI-driven tools for demand planning and inventory management, with traditional planning augmented by predictive analytics. The salary range is 65,000to
65,000to95,000.
Supply Chain Optimization Analyst requires three to six years of experience. You build optimization models, analyze network trade-offs, and recommend supply chain design changes. The salary range is 80,000to
80,000to120,000.
Supply Chain Analytics Manager requires five to eight years of experience. You lead analytics initiatives, manage tool implementation, and present insights to leadership. The salary range is 100,000to
100,000to150,000.
LLamasoft/Blue Yonder Solution Consultant requires four to eight years of experience. You implement supply chain design software for clients, lead network optimization studies, and train users. The salary range is 90,000to
90,000to140,000 plus travel.
Supply Chain Data Science Manager requires seven or more years of experience. You lead data science teams, set analytics strategy, and report to the C-suite. The salary range is 130,000to
130,000to180,000.
Required Skills Based on Industry Standards
Based on analysis from MSU's supply chain program and industry partners, employers expect a specific combination of technical, analytical, and functional skills .
Technical skills require proficiency with supply chain platforms: Blue Yonder, LLamasoft, or equivalent. You need Python skills for optimization modeling with PuLP and Pandas . R skills for statistical forecasting and time series analysis are essential . Tableau skills for visualization and dashboarding are non-negotiable . Basic SQL for data extraction and manipulation completes the technical stack.
Analytical skills include demand forecasting using time series methods and machine learning. Inventory optimization includes safety stock calculation and reorder point determination. Network design requires facility location modeling and flow optimization. Risk analytics requires disruption prediction and contingency planning. Prescriptive analytics requires optimization model formulation and solver configuration.
Functional supply chain knowledge includes demand planning processes and metrics. Inventory management requires understanding of turns, fill rates, and stockout costs. Logistics and transportation requires knowledge of lead times, modes, and carrier networks. Procurement requires supplier management and risk assessment. Manufacturing requires production scheduling and capacity planning.
The LLamasoft senior vice president of customer success notes: "There is a gap within our industry for supply chain analytic talent—those who can bridge the operational and digital worlds to elevate lives and organizations through the science of smarter decision making" .
Certifications That Matter
LLamasoft Certification is available through authorized training partners. Students who complete LLamasoft programs earn certifications that validate proficiency, conferring a digital badge they can feature on LinkedIn .
Blue Yonder Certification is available through Locus IT Services and other authorized partners. Training covers AI and machine learning capabilities for supply chains .
Tableau Desktop Specialist costs $125 and validates basic analytics proficiency .
DataCamp Supply Chain Analytics provides a case study certificate upon completion .
APICS Certification remains the gold standard for supply chain knowledge—CPIM or CSCP credentials are highly valued.
The Supply Chain Analytics Job Search Strategy
The MSU Broad College of Business collaboration with LLamasoft and Alteryx during the pandemic demonstrates the power of industry partnerships for skills development. This cutting-edge software gives professionals a competitive advantage, improving employability and enhancing knowledge of real-world concepts like data transformation, modeling, and visualization .
Your portfolio matters more than your certifications. Create a Tableau Public profile showcasing your supply chain dashboards . The public gallery allows employers to see your work directly. Feature your Python optimization models on GitHub. Show your R forecasting code in a public repository.
On your resume, replace generic bullet points with analytics-specific achievements. For example: "Implemented Python PuLP optimization model that reduced total landed cost by 12 percent across 50 SKUs" or "Designed Tableau dashboard tracking inventory turns, reducing stockouts by 25 percent."
In interviews, articulate specific supply chain analytics workflows you have built. Carlos Valderrama's statement captures the value: "Partnering with MSU facilitates a pipeline between talent supply and talent demand" . Frame yourself as that talent—ready to bridge the operational and digital worlds.
Interview questions to prepare for include: How would you forecast demand for a new product with no historical data? Walk me through how you would determine optimal safety stock levels. Describe a time you used optimization to solve a supply chain problem. How do you communicate complex analytics to non-technical stakeholders? What metrics would you include in a supply chain control tower dashboard? Tell me about a data-driven improvement you made to a supply chain process.
The 30-60-90 day framework for supply chain analytics roles includes auditing available data sources and analytics maturity in the first month, identifying quick-win opportunities for improvement. The second month focuses on delivering one optimization model or forecast improvement and building an executive dashboard. The third month is about scaling—implementing automated reporting, establishing continuous improvement processes, and presenting ROI to leadership with specific metrics on cost reduction and service improvement.
Industry Partnerships and Career Pathways
The collaboration between MSU's supply chain department, LLamasoft, and Alteryx demonstrates how industry partnerships create career pathways. The digital badges that accompany LLamasoft certifications are a great way to demonstrate and promote supply chain competency, especially when competing for jobs .
When negotiating salary, note that certified supply chain analytics professionals command premiums over traditional supply chain roles. The gap for supply chain analytic talent means demand exceeds supply . You can credibly state that your combination of platform proficiency (Blue Yonder or LLamasoft) and technical skills (Python, R, Tableau) places you in a high-demand category with limited qualified candidates.
Academic Pathways
Michigan-based LLamasoft has longtime connections with university faculty through formal partnerships with supply chain management departments . If you are considering further education, look for supply chain programs with LLamasoft or Blue Yonder partnerships—these provide hands-on platform experience and certification opportunities.
The Alteryx for Good program offers the platform and training for all educators and students free of charge "to give back and to help everyone become more digitally capable" . Similar programs may exist for other analytics platforms.
Immediate Next Steps for the Next 7 Days
Day One: Download and install Anaconda (free) to get Python, Pandas, and essential data science libraries. Clone the supply_chains_optimization GitHub repository . Run the first Jupyter notebook to understand PuLP basics.
Day Two: Install R and RStudio (free). Install the 'sweep' package and run the forecasting vignette . Understand how multiple models compare against each other.
Day Three: Sign up for Tableau Public (free). Watch the "Tableau for Beginners - Full Course" on YouTube . Build your first simple bar chart.
Day Four: Research LLamasoft and Blue Yonder. Request demos or watch recorded product webinars. Understand the difference between network design (LLamasoft) and supply chain planning (Blue Yonder) .
Day Five: Define your portfolio project focus. Choose between the demand forecast model, network optimization model, Tableau dashboard, or integrated case study. Commit to completing one project within 30 days.
Day Six: Update your LinkedIn headline. Change it from "Supply Chain Professional" to "Supply Chain Analytics | Optimization + Forecasting + Visualization." Add the certifications and skills you are building.
Day Seven: Start your first portfolio project. Document your process publicly on GitHub and LinkedIn to build visibility and demonstrate the analytics mindset hiring managers seek. The digital badges from certifications are a great way to promote your competency, especially when competing for roles .
The Long Game
Supply chain analytics is one of the fastest-growing specializations in operations. The gap for supply chain analytic talent—those who can bridge the operational and digital worlds—is significant . The organizations that will thrive are those that invest in building this talent pipeline.
The most successful supply chain analytics professionals in 2026 will be hybrid practitioners. They will combine domain expertise in supply chain processes with technical proficiency in optimization, forecasting, and visualization. They will know how to use enterprise platforms like Blue Yonder and LLamasoft, but also how to build custom models in Python and R. They will communicate insights through Tableau dashboards that drive decisions.
Your operations background is your foundation. You already understand inventory turns, lead times, and service levels. You know what questions to ask. This roadmap builds the technical tools—Python optimization, R forecasting, Tableau visualization, enterprise platforms—that transform an operations professional into a supply chain analytics leader.
The digital badges that accompany LLamasoft certifications are a great way to demonstrate competency . But your portfolio matters even more. Build something real. Optimize a real network. Forecast real demand. Visualize real KPIs. Share your work publicly.
Start your week one actions today. Download Python and run that first optimization notebook. Install R and run that first forecast. Sign up for Tableau Public and build that first dashboard. The market for supply chain analytics talent has never been stronger , and the professionals who can bridge the operational and digital worlds will shape the future of supply chain management.
Experience / Knowldge of supply chain


 Group / 1: 1 Sessions