Description
Here is a list of popular Business Intelligence (BI) tools, categorized by their typical use cases and deployment styles.
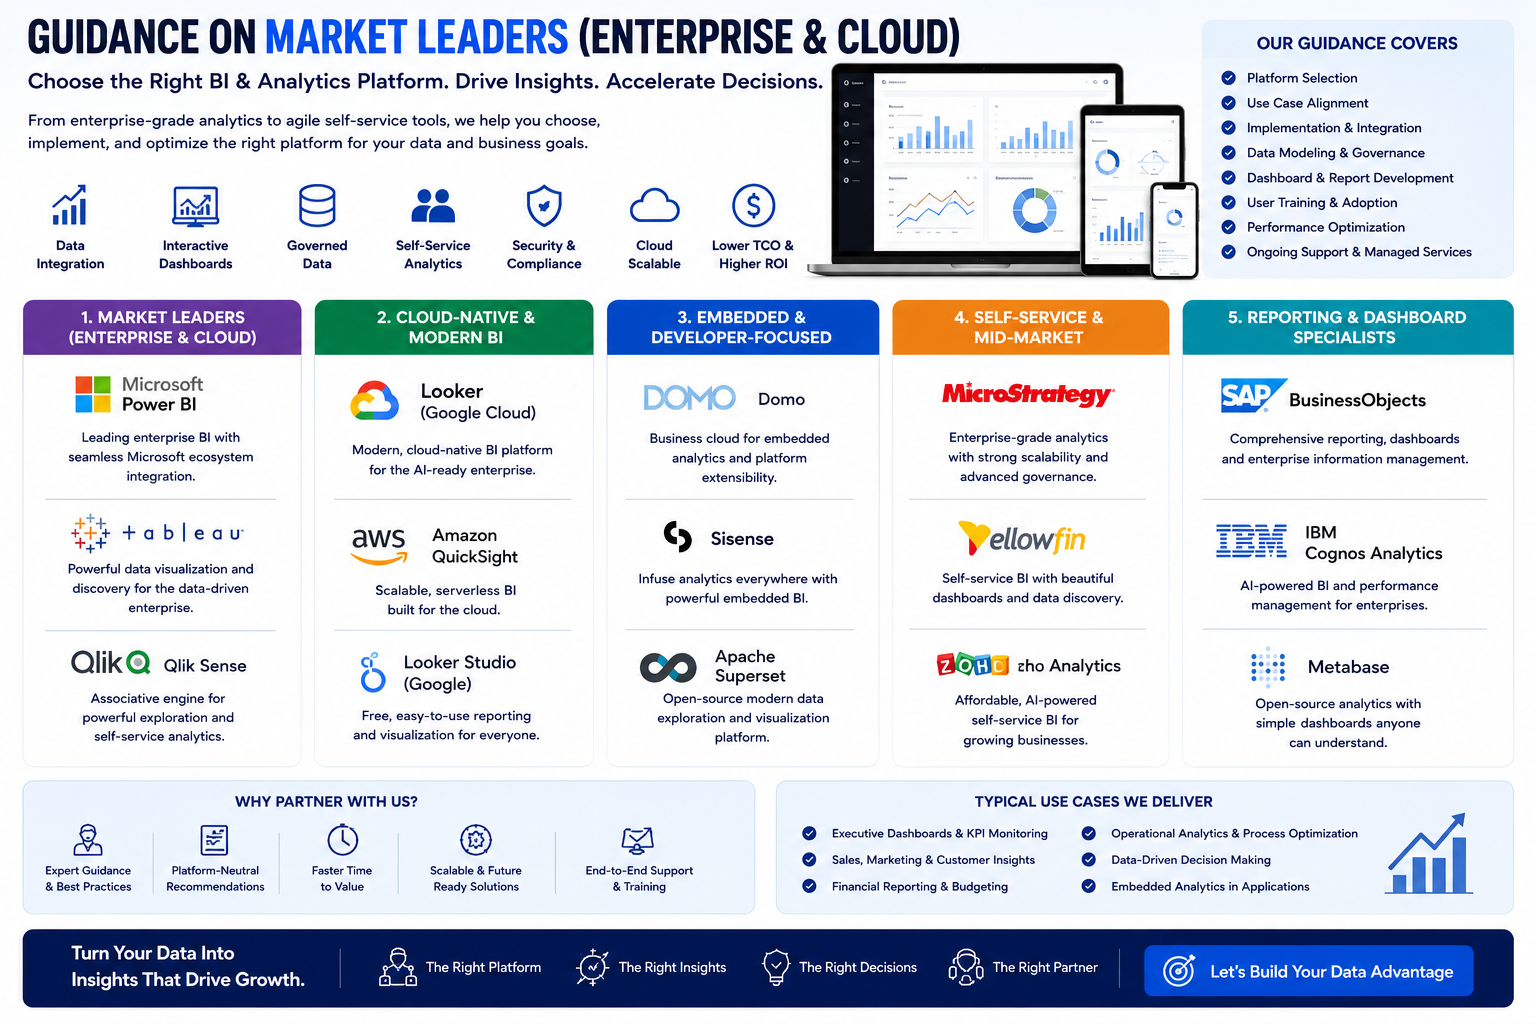
Market Leaders (Enterprise & Cloud)
- Microsoft Power BI
- Best for: Organizations heavily using Microsoft products (Excel, Azure, Teams).
- Strengths: Strong Excel integration, robust data modeling (DAX), competitive pricing.
- Tableau
- Best for: Advanced visual analytics and complex data exploration.
- Strengths: Superior visualizations, drag-and-drop interface, strong calculations. (Now part of Salesforce).
- Qlik Sense
- Best for: Associative data indexing (exploring hidden relationships).
- Strengths: No rigid query paths; in-memory processing for speed; strong data integration via Qlik Compose.
Cloud-Native & Modern BI
- Looker (Google Cloud)
- Best for: Teams that need a semantic layer (a reusable business logic hub) directly in the cloud.
- Strengths: LooksML (code-based governance), native integration with BigQuery.
- Amazon QuickSight
- Best for: AWS-powered organizations.
- Strengths: Serverless (no infrastructure management), pay-per-session pricing, built-in NLP (Ask Q).
- Google Looker Studio (Free option)
- Best for: Simple dashboards and marketing data (Google Analytics, Ads).
- Strengths: Free, easy collaboration, connects natively to Google Sheets.
Embedded & Developer-Focused
- Domo
- Best for: Business leaders needing a connected "cloud OS" across sales, finance, and HR.
- Strengths: 1,000+ pre-built connectors; strong mobile app; real-time alerts.
- Sisense
- Best for: Embedding analytics directly into other applications (SaaS products).
- Strengths: In-Chip technology for speed; supports single-tenant and multi-tenant embedding.
- Apache Superset
- Best for: Engineering teams wanting open-source, customizable dashboards.
- Strengths: Free, scales to petabyte datasets, semantic layer, works with most SQL databases.
Self-Service & Mid-Market
- MicroStrategy
- Best for: Large enterprises needing government-grade security and mobile analytics.
- Strengths: HyperIntelligence (zero-click insights); supports multi-cloud and on-prem.
- Yellowfin
- Best for: Automated insights (anomaly detection and commentary).
- Strengths: Built-in data storytelling (Stories), automated analysis (Signal).
- Zoho Analytics
- Best for: Small to medium businesses using Zoho suite or seeking very low-cost entry.
- Strengths: AI assistant (Zia), drag-and-drop, marketplace for 500+ data sources.
Reporting & Dashboard Specialists
- SAP BusinessObjects
- Best for: Legacy SAP ERP customers needing structured reporting.
- Strengths: Universe design tool, robust pixel-perfect reporting (Web Intelligence).
- IBM Cognos Analytics
- Best for: Large enterprises needing strict governance and on-premise control.
- Strengths: AI-driven exploration, natural language generation, strong scheduling.
- Metabase
- Best for: Lightweight, SQL-friendly internal dashboards (open source).
- Strengths: Very easy setup (runs on a JAR file), drill-through, GUI query builder.
Strategic Training Roadmap by Career Stage
Stage 1: The Foundation (Choose ONE Market Leader)
Your goal here is to master the core concepts of data transformation (ETL), data modeling, and dashboard creation. Investing in either Power BI or Tableau first is the highest-leverage move for your career, as they dominate the job market.
Path A: Microsoft Power BI (Recommended for broadest accessibility)
- Core Focus: Mastering Power Query (for data cleaning), the data model (relationships), and DAX basics (for calculations).
- Roadmap:
- Understand the Ecosystem: Learn the difference between Power BI Desktop (for building) and Power BI Service (for sharing).
- Hands-on Data Cleaning: Spend significant time in Power Query transforming messy CSV/Excel files.
- Build Visuals: Create bar charts, line charts, and matrices via drag-and-drop.
- Learn DAX Fundamentals: Start with
SUM, CALCULATE, and FILTER before moving to complex time intelligence.
- 💡 AI Integration: Microsoft has integrated Copilot into Power BI. This AI assistant can generate DAX code, create report pages, and provide natural language insights. While access may require a paid license (like Fabric F2), understanding its capability to speed up development is a major resume booster.
- Resources:
- Free: Microsoft Learn (the official, structured "Get started with Microsoft data analytics" path). YouTube (Channels: Guy in a Cube, Curbal).
- Paid: Udemy/Coursera (project-based courses). Microsoft PL-300 Certification (The gold-standard certification for Data Analysts).
Path B: Tableau (Recommended for visual analytics)
- Core Focus: Visual best practices, calculated fields, and dashboard actions.
- Roadmap:
- Connect to Data: Learn to connect to files and databases.
- Drag-and-Drop Analytics: Build charts using "Show Me" and understand discrete vs. continuous dates.
- Dashboards: Master actions (filter, highlight, URL) to create interactive stories.
- 💡 AI Integration: Tableau Pulse (powered by Salesforce Einstein) provides AI-driven explanations for data changes ("Why did sales go up?").
- Resources:
- Free: Tableau Public (build a public portfolio). Salesforce Trailhead (gamified learning modules). DataFam YouTube & Community Projects (weekly challenges).
- Paid: Tableau Creator E-Learning (approx. $120/year for self-paced). Instructor-led Desktop I & II sessions.
Stage 2: Horizontal Expansion (Cloud & Self-Service)
Once you know one tool, the logic of others becomes clear. Here, you learn to adapt.
- Google Looker Studio (Free): Since it’s free and browser-based, this is easy to add. Focus on connecting to Google Sheets/Ads and using the "Blend Data" feature. Roadmap: Take the "Looker Studio Essentials" course on Pluralsight. AI Note: Google’s Gemini AI is being integrated for natural language report building.
- Amazon QuickSight: Only deep-dive here if your target company uses AWS. Focus on the "SPICE" engine (in-memory calculation) and the "Q" natural language prompt. Roadmap: Courses on Pluralsight or AWS Skill Builder.
Stage 3: Specialization (Developer & Embedded)
If you prefer coding over drag-and-drop, or want to build analytics into a product, pivot here.
- Apache Superset (Open Source): The Roadmap: Learn Python basics first, then install Superset via Docker. Focus on SQL Lab (writing SQL to fetch data) and managing Row-Level Security.
- Resources: "Ultimate Apache Superset" (book/guide on GitHub). Official Superset documentation.
- Sisense (Embedded): Unique Tactic: Sisense offers a "Test Drive" environment (free for 7 days) specifically for developers to test API-first embedding. Focus on the Compose SDK for code-driven customization.
Stage 4: Specialization (Enterprise Reporting)
If you work in massive, regulated industries (Banking/Healthcare), learn these.
- Domo: The strategy is "Modern Cloud OS." Look for Domo University. They offer a free "Hands-on Training Series" covering Analyzer, Magic ETL (data transformation), and Dashboards.
- MicroStrategy & IBM Cognos: These are less common for "new learners" because they require enterprise servers. The Roadmap is corporate-led: If your employer uses them, ask for access to their internal training or official instructor-led courses. Focus on Pixel-Perfect Reporting (making reports look exactly like a printed invoice).
Career Application & Next Steps
Instead of just listing certifications, here is how to apply this training to your job search immediately.
Next Step 1: Build a Portfolio of "Three Reports"
Do not just show you know the buttons. Show you can solve problems.
- Report 1 (Cleaning): Take a messy Excel file (e.g., sales data with blanks and errors). Use Power Query (or Tableau Prep) to document each step of cleaning it.
- Report 2 (Relationship): Take two tables (e.g., Sales and Customer data). Load them into Power BI/Qlik Sense, define the relationship (Join), and create a single chart that uses fields from both tables.
- Report 3 (AI Insight): In Power BI or Tableau, use the built-in "Explain the increase" or "Analyze" feature to let the AI find a correlation (e.g., "Sales are highest when shipping is standard").
Next Step 2: Target the "Hybrid" Job Description
Update your resume with these specific phrases:
- Instead of "Made charts," write: "Designed a star-schema data model in Power BI that reduced query refresh time by 40%."
- Instead of "Know Tableau," write: "Built an interactive executive dashboard in Tableau with drill-down actions and parameter controls."
Next Step 3: Get the Right Certification
- If you are new to data: Skip the expensive certs. Build the portfolio on Tableau Public (free) or a GitHub portfolio showing Power BI PDFs.
- If you are switching careers: Target the Microsoft PL-300. It is the most vendor-recognized entry-level certification on the market, heavily featured in job listings.
- If you are a Developer: Contribute to an Apache Superset repository or publish a "How to Embed Sisense" guide on Medium.
Next Step 4: Free vs. Paid Strategy
- Free Path (Totally viable): Use Power BI Desktop (free app) + Microsoft Learn (free training) + Tableau Public (free portfolio). You only need a work/school email to publish to the Power BI Service.
- Paid Path (Faster): Spend 15−
- 15−30 on a Udemy "Bootcamp" for a specific tool (they go on sale weekly). Spend 120/yearfor∗∗TableauE−Learning∗∗ifyouwantstructuredvideolessons[citation:3].Payforthe∗∗PL−300exam∗∗(
- 120/yearfor∗∗TableauE−Learning∗∗ifyouwantstructuredvideolessons[citation:3].Payforthe∗∗PL−300exam∗∗(165) as the final cherry on top.
Requirements
Tech Background, Data science Background


 Group / 1: 1 Sessions