This roadmap is designed to take you from a foundational understanding of observability to a professional who can design, implement, and manage comprehensive systems that answer the most important question: "Why is this happening?" You will learn to correlate metrics, logs, and traces—the three pillars of observability—using both open-source tools and AI-assisted platforms. This knowledge prepares you for roles like Site Reliability Engineer (SRE), DevOps Engineer, or Observability Specialist, where you will reduce Mean Time to Detection (MTTD) and Mean Time to Resolution (MTTR) for system incidents.
🗺️ Phase 1: Foundations – What is Observability & Why It Matters (Weeks 1-3)
Before diving into tools, you must understand the core principles and how observability differs from traditional monitoring.
- Observability vs. Monitoring: Understand that monitoring tells you when something is wrong (e.g., "CPU is at 95%"). Observability enables you to ask why it is wrong by exploring system behavior through its external outputs (metrics, logs, traces). Think of monitoring as knowing the car's dashboard lights are on; observability is having the full diagnostic tool to investigate the engine.
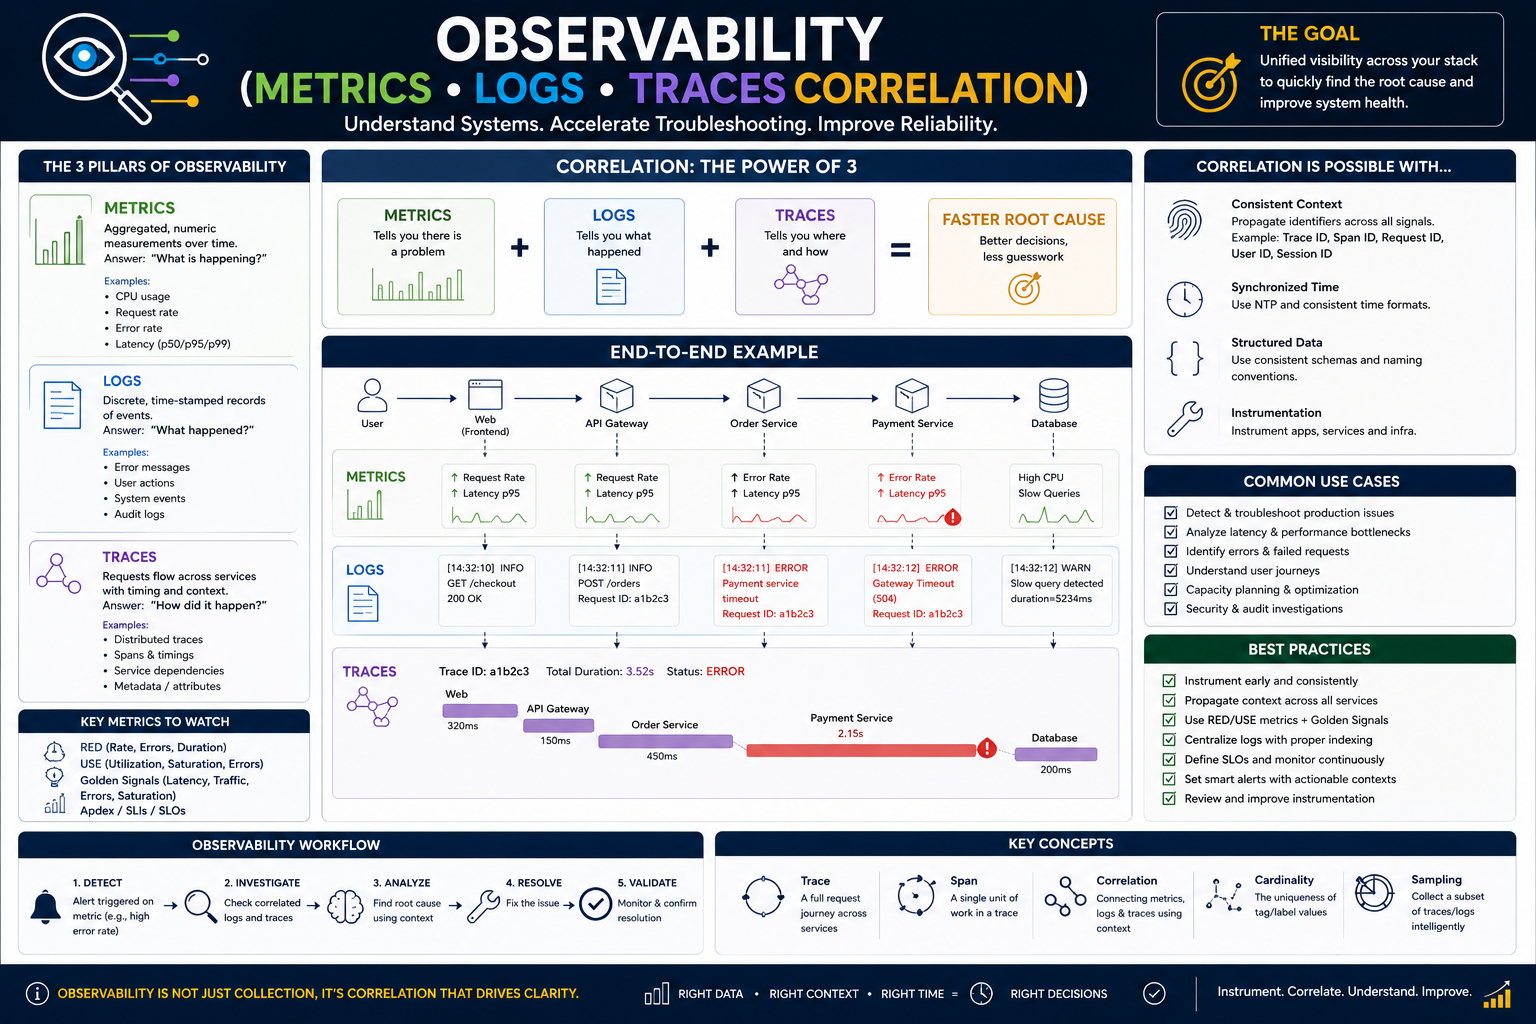
- The Three Pillars:
- Metrics: Numeric, time-series data about your system (e.g., request latency, error rate, CPU usage). They are great for alerting and trend analysis.
- Logs: Structured or unstructured text records of discrete events (e.g., an error message with a stack trace). They provide high-cardinality details crucial for debugging.
- Traces: Represent a request's journey as it travels through multiple services in a distributed system (e.g., a user request passing through an API gateway, then an authentication service, then a database). They are essential for understanding service dependencies and latency bottlenecks.
- Key Concepts to Master: Learn the Golden Signals (Latency, Traffic, Errors, Saturation) and how to design Service-Level Indicators (SLIs) and Service-Level Objectives (SLOs) with error budgets. An SLO might be "99.9% of requests complete in under 200ms." This provides a data-driven framework for reliability.
Free Resources for Phase 1:
- Free Introductory Course: Platform Engineering offers an excellent, free introductory course on Observability and OpenTelemetry, perfect for building your conceptual foundation.
- Online Learning Hub: Coursera's "Observability Engineering: Metrics, Logs, Traces" course provides a structured, video-based introduction, complete with hands-on demonstrations.
🛠️ Phase 2: The Technical Toolkit – Mastering OSS Tools (Weeks 4-10)
This phase focuses on the industry-standard open-source tools that form the backbone of most observability stacks.
Metrics & Visualization: The LGTM Stack
- Prometheus: The de facto standard for metrics collection. Learn to expose metrics from your applications, configure Prometheus to scrape them, and write PromQL (Prometheus Query Language) queries to analyze data.
- Grafana: The leading open-source visualization tool. Learn to build dashboards, create panels from PromQL queries, and configure alerting rules to notify you when SLOs are at risk.
- Practice Scenario: Install Prometheus and Grafana (using Docker is easiest). Set up a Node Exporter to collect system metrics from your laptop or a test VM. Use PromQL to graph CPU usage, then build a Grafana dashboard to visualize it and set up an alert for when it exceeds 80% for 5 minutes.
Logs: Centralized Aggregation & Querying
- Loki: A horizontally-scalable, cost-effective log aggregation system designed to integrate seamlessly with Prometheus and Grafana. Learn to ingest logs from your applications (using Promtail or Fluent Bit) and query them using LogQL.
- ELK/EFK Stack (Elasticsearch, Logstash/Fluentd, Kibana): Another powerful, widely-used stack for log management. Understand its different use cases compared to Loki.
- Practice Scenario: Extend your Docker setup from the metrics phase. Run Loki and Promtail to collect the logs from your Prometheus container and your own test application. In Grafana, integrate your Loki data source and learn to explore logs, filtering by labels and time ranges.
Traces: Understanding Distributed Requests
- OpenTelemetry (OTel): The single most important technology to learn. It is a vendor-agnostic, open-source standard for generating and collecting telemetry data (metrics, logs, and traces) from your applications. It replaces proprietary agent SDKs.
- Jaeger & Tempo: Distributed tracing backends that store and query your trace data. Jaeger is a popular open-source option, while Tempo is Grafana's integrated solution.
- Practice Scenario: Take a simple multi-service application (e.g., a "Hello World" app with a database call and an external API fetch). Instrument it using the OpenTelemetry SDK for Python, Java, or Go. Configure it to export traces to Jaeger, then view the trace's "waterfall" diagram to visualize the latency of each call.
Free & Paid Resources for Phase 2:
- Free Hands-on Lab:
- QA Platform's "Observability: OpenTelemetry" lab: A 2-3 hour guided lab where you practice implementing OpenTelemetry auto-instrumentation, manual instrumentation, and metrics collection in a real environment.
- Structured Paid Training:
- Coursera's Observability Engineering Course: A deep, 4-module program that walks you through installing, configuring, and using Prometheus, Grafana, Loki, Fluent Bit, and Jaeger. It includes knowledge checks and hands-on practice assignments.
- The GTC Group's "Monitoring and Logging in Cloud Environments": A 3-5 day instructor-led course covering Prometheus, Grafana, and the ELK stack, suitable for those who prefer a classroom or virtual classroom setting.
- Koenig's "Getting Started with OpenTelemetry (LFS148)": An 8-hour live training focused specifically on OpenTelemetry instrumentation.
🤖 Phase 3: Correlation & Advanced Practices (Weeks 11-14)
The goal of this phase is to break down silos. A metric spike should lead you directly to the relevant logs and the offending trace.
- Correlation Strategies: Learn the techniques to link your telemetry pillars. The most common method is using a consistent
trace_id and span_id across all signals. An alert from Prometheus for high latency should include the trace_id of the slow request. In Grafana, you can then click a data link to jump directly to the logs for that trace_id in Loki, and then to the full trace in Tempo or Jaeger. This turns a 30-minute debugging session into a 30-second root cause identification. - Advanced Alerting & AI: Move beyond static thresholds to reduce alert fatigue. Learn to configure Alertmanager and explore features like machine learning-based anomaly detection (available in Grafana Cloud and Enterprise) which can learn your system's normal behavior and alert on unusual patterns.
- Observability for AI/LLM Systems: As you work with generative AI applications, observability changes. You need to track not just CPU and memory, but also prompt templates, token usage, model versions, guardrail interventions, and evaluation metrics like "groundedness" (whether the AI's answer is based on the provided context).
- Key Practice: Implement structured logging for an LLM app that captures
prompt_template_id, model_name, input_tokens, output_tokens, guardrail_action, and a feedback signal from the user. This allows you to correlate a poor user rating with a specific model version and the prompt that caused it.
Resources for Phase 3:
- Coursera's AI Module: The same Coursera course includes a specific module on AI-powered anomaly detection in Grafana and an introduction to AI in observability.
- Skywork.ai Blog: The article "Observability for Skills" provides a field-tested playbook and concrete JSON schemas for logging and tracing in LLM-based applications.
📚 Resource Toolkit: Deeper Learning & Practice
Free & Low-Cost Practice Environments:
- Giant Swarm's Observability Platform: They offer a fully integrated, OTLP-native observability stack based on Loki, Grafana, Tempo, and Mimir. Running in your own environment, it provides a correlated view of metrics, logs, and traces out of the box, eliminating the "observability assembly tax" of setting up and maintaining tools yourself.
- Docker Desktop: Your primary practice sandbox. You can spin up the entire LGTM stack (Loki, Grafana, Tempo, Mimir) plus a sample application using
docker-compose in minutes. The OpenTelemetry Demo application is an excellent, realistic microservice architecture to practice on. - AWS Free Tier: Explore Amazon Managed Prometheus, Amazon Managed Grafana, and the AWS Distro for OpenTelemetry (ADOT). Set up an EKS cluster (using
eksctl), deploy the OpenTelemetry Demo app, and send its telemetry to the managed services.
High-Value Paid Training:
- Coursera (Observability Engineering): This is your most comprehensive, structured, and affordable path. For a monthly subscription fee, you get expert-led video content, hands-on demos, graded assignments, and a shareable certificate. It covers all three pillars, correlation, and even AI-powered features.
- Pluralsight / A Cloud Guru: Subscriptions provide access to entire learning paths on observability, including courses on specific tools like Prometheus, Grafana, and OpenTelemetry, often with sandbox environments.
AI-Assisted Learning:
- Use LLMs as a "Tutor" or "Debugger": When you encounter a confusing PromQL query or a Jaeger trace you don't understand, paste it into an LLM (like ChatGPT or Claude). Ask: "Explain this PromQL query step-by-step" or "Based on this Jaeger trace, which service is the bottleneck and why?" This accelerates problem-solving and deepens understanding.
💼 Career Application & Next Steps
Observability skills are in high demand and directly applicable to high-salary roles in modern tech companies. Your ability to prove you can correlate data to solve problems is your ticket into these roles.
1. The Job Market & Your Target Roles
Roles requiring these skills are numerous and well-compensated.
- Site Reliability Engineer (SRE): The primary role for observability skills. You'll be responsible for the reliability, performance, and scalability of critical systems, using observability as your primary tool.
- DevOps Engineer: You'll build and maintain the CI/CD pipelines and infrastructure, and implementing robust observability is a core part of ensuring operational stability.
- Observability Engineer / Platform Engineer: A specialist role focused entirely on designing, building, and maintaining the internal observability platform used by all other engineering teams.
- Cloud Engineer: You'll need to know how to monitor and troubleshoot applications running on AWS, GCP, or Azure.
2. Build Your Portfolio (The "Proof" is in the Correlation)
Theory is not enough. You need a story that demonstrates you can move from a "problem" to "root cause" using correlated data. Your GitHub portfolio should showcase this.
- The Ultimate Portfolio Project: Set up a demo e-commerce or bookstore microservices application (the OpenTelemetry Demo app is perfect). Instrument it with OpenTelemetry. Deliberately introduce a failure—for example, inject a random 5-second delay in the "checkout" service. Then, document your debugging journey. Show how a Prometheus alert for high checkout latency led you to a Grafana dashboard. From there, show how you used a data link to find the logs for the slow request and, finally, how you clicked through to the Jaeger trace that visually pinpointed the exact 5-second delay span within the checkout service itself. Narrate this story in a
README.md file in your GitHub repo. This single project demonstrates mastery of instrumentation, metrics, logs, traces, and—most importantly—correlation.
3. Certifications That Validate Your Skills
While not strictly mandatory, certifications prove your knowledge to employers and recruiters.
- For Open Source Tools: There is no single official certification, but a Coursera Specialization Certificate in Observability Engineering holds weight, as it is project-based and from a reputable platform.
- For Cloud-Specific Observability:
- AWS Certified DevOps Engineer – Professional or AWS Certified Solutions Architect – Associate cover monitoring and logging services like CloudWatch, X-Ray, and Managed Prometheus/Grafana.
- The Kubernetes Certified Application Developer (CKAD) or Administrator (CKA) certify your ability to manage applications on Kubernetes, which includes setting up monitoring and observability for them.
4. Grow Your Network and Experience
- Community & Events: Watch recordings and attend events from companies that have publicly shared their observability journeys. The Nubank Engineering Meetup talk on building their internal log platform using OpenTelemetry and AWS is a fantastic real-world case study. LinkedIn posts from industry experts often highlight new resources and training opportunities.
- Open Source Contributions: Consider contributing to open-source observability projects. Even a small documentation fix or a simple example application for a project's
examples directory is a fantastic way to learn the codebase and earn a real-world contribution credit.
5. The Interview Question You Will Be Asked
*"A user reports that the checkout page on our e-commerce site is intermittently taking 10 seconds to load. How would you use observability tools to diagnose this?"*
Your Answer: *"First, I would check our Prometheus metrics dashboard for the checkout service, looking for its 99th percentile latency. I would expect to see a spike. Clicking on that spike in Grafana, which is linked to our logs, would bring me to the error logs from that time window. The logs would likely contain the trace_id of the slow requests. I would then use that trace_id to query our Jaeger tracing system. Jaeger would show me a 'waterfall' diagram of the entire request's journey through our microservices. I could quickly identify the exact span that took 9.5 seconds, for instance, a span showing a call to a 'discount-service' that is timing out. This would give me the exact service, operation, and even the request parameters to hand off to the development team."*
This answer shows you understand not just the tools, but the workflow of correlation that leads to rapid incident resolution.
Next Step: Do not attempt to master everything simultaneously. Choose a single practice environment (Docker is best) and start your journey today.
- Install Docker Desktop on your local machine.
- Follow the official guide to run the OpenTelemetry Demo application on your machine. This will automatically spin up an entire microservice environment with metrics, logs, and traces pre-instrumented.
- Access the Jaeger UI (usually on port 16686) and explore a few traces. Click on spans and look at their tags.
- Access the Grafana UI (port 3000) and explore the pre-built dashboards. Click on a dashboard panel and see how it uses data from Prometheus.
- The moment you see your first trace in Jaeger and understand its waterfall diagram, you will have crossed the threshold from knowing about observability to practicing it. This is the single most important step.


 Group / 1: 1 Sessions